Delivered at CAMX, Sept. 25, 2019.
Geoffrey E. Clarkson, P.Eng.
UTComp Inc
Cambridge ON, Canada
ABSTRACT
Reinforced Polymer composite materials are proven to provide superior performance in many infrastructure environments. Examples of opportunities for these include: wind turbine blades; sheet molded shapes; pultruded structural shapes; extruded rail ties; and others.
This paper describes a quantitative ultrasonic process for assessing the structural performance of fiber reinforced polymer (FRP) or composite materials. Ultrasonic signals passing through the material are analyzed for how the signal changes from the passage. These changes have been shown to relate directly to structural performance of the material. Example will be given of composite railway tie production.
The original quality control problem started with identification of defects exceeding a given size. In addition to reliable identification of defects, bench scale tests showed good correlation of ultrasonic results and a key structural criterion for rail tie acceptance for use. Since the structural criterion is destructive, minimizing these tests is desirable.
The subject testing system is applied soon after mold release when the polymer can accept contact from transducers. Computer automation is applied to conventional and commercially available ultrasonic equipment to provide quantitative assessment of the structural condition of railway ties. Tooling and software has been developed to provide in-line, real time assessment of railway tie performance in destructive load tests.
This paper will illustrate the bench data and characterization data that was used to develop the inspection technique. The operating system that developed from this has ongoing comparison of system outputs with destructive load tests.
1. INTRODUCTION
Reliable performance of composites in structural applications requires non-destructive methods that can verify structural integrity.
This paper describes developments in ultrasonic non-destructive testing of glass fiber reinforced polymer composites that have been made using recycled thermoplastics and closed-mold methods. The originating request was to detect defects that have occurred during molding. The purpose of this paper is to describe how readily available hardware was combined with purpose-designed software and mechanisms for automated inspection of fiber reinforced polymer (FRP) rail ties. The paper describes the methods and technologies that were used for initial bench testing and prototyping of a system for deployment.
It is intended that this paper will interest those directly involved with manufacturing, engineering, quality assurance and testing of composite products.
1.1 Basic Ultrasonic Testing Principles
Ultrasonic testing has been used since 1940. Most work using ultrasound identified that invisible inhomogeneities within materials could be detected. For most of the 79 years since the first patent application, the focus of ultrasonic testing has been on metals. In the case of ultrasound, a pressure pulse is applied to material and inhomogeneities are detected when a feature blocks some of the path – features that are parallel to the path direction are generally not detected.
Use of fiber reinforced polymer composites for structural applications has been pursued since the 1930’s. Starting with the growth of commercial aircraft starting in the 1960’s, many investigations were conducted into use of ultrasound to detect flaws and defects in composites. Ultrasound is the most common non-destructive technology used for composite materials, with the primary focus remaining detection of features within the material that interrupt its path.
Ultrasonic pulses can be applied to materials in three main modes:
- pulse-echo, where the pulse is applied to the surface by the same transducer that receives reflected energy from within the material,
- thru-transmission, where the pulse is applied to one surface by one transducer and the pulses that pass through the material are received by a transducer placed on the opposite surface, and
- pitch-catch, where the pulse is applied to the surface by one transducer and another transducer on the same surface receives reflected energy within the material.
Ultrasonic pulses can range in frequency from 100,000 Hertz (0.1 MHz) to beyond 20 MHz. When used with glass reinforced composite materials, signal losses in the material increase with frequency, making the highest reasonable frequency 1.0 MHz. Work completed for this paper uses a nominal ultrasound frequency of 500 kHz. Work done by the author has found attenuation values ranging from 0.3 to 2.0 decibels (dB)/mm (7.62 to 50.8 dB/in).
In ultrasonic testing, an energy pulse is applied to the face of a material by an actuator, or transducer. These pulses have a short wavelength which translates into a wave frequency in the range listed above. Ultrasound uses two primary modes to travel through a material – longitudinal and transverse waves. This paper limits itself to discussion of longitudinal waves.
Conventional ultrasonic evaluation usually examines energy pulses at a receiving transducer to determine whether the signals generated show that a defect exists within the material. Reduction in the energy of the applied pulse occurs at every interface that the pulse must cross, as well as from absorption and dispersion by the material that the pulse passes through. This reduction in energy is known as attenuation. Figure 1 provides illustrates how a void within a material attenuates the energy of the pulse in a thru-transmission mode. Note that the illustration shows reduction in the amount of signal that passes through the “void” area. This illustration is simplified and does not include dispersion of the ultrasonic pulses.

Figure 1: Illustration of Attenuation by Defect
As noted above, the signal is attenuated at interfaces and by the materials. As the ultrasonic energy pulses move from the Transmitting Transducer to the Receiving Transducer, the pulse magnitude is attenuated by the following:
- Crossing the boundary from the Transmitter into the Coupling Agent
- Within the Coupling Agent
- Crossing the boundary from the Coupling Agent to the Inspected Material
- Within the Inspected Material
- Crossing the boundary from Inspected Material to Coupling Agent
- Within the Coupling Agent
- Crossing the boundary from the Coupling Agent to the Receiver.
For material inspection and evaluation, it is required that the signal applied and transmitted through the material be isolated from all of the other factors. It is also necessary to know how much energy is being applied. Reliable assessment requires that values be known from measurements rather than calculated from settings on an instrument.
1.2 Glass Reinforced Polymer Composite Railway Crossties
Railway crossties are used to support the rails on a ballast roadbed and to hold the rails in place for train wheels. They are an integral component of the rail transportation system. Most rail crossties are made from wood. In the United States alone, there are at least 220,000,000 railway crossties in use and average annual replacement is about 20,000,000 units.
Railway reliability and durability requires that rail ties meet certain performance standards such as; Modulus of Elasticity, Modulus of Rupture (calculated from bending), dimensional stability, and others. Many of these parameters are determined from destructive tests and the performance any wood crosstie may not be well-predicted by this since there is so much variation in non-engineered materials. The Modulus of Rupture (MOR) is considered to be a key parameter. As for any material that is subjected to bending, the most important parts of the material to resist bending are the upper and lower surfaces – this is why many steel beams are “I” shaped.
Some other requirements for wood crossties are listed below. Except for twisting, these items would not apply to FRP units.
- Heavy creosote retention (black) with four solid sides.
- Dry rot and plate cutting not permissible.
- Twisted ties not permissible.
- Limited end splitting.
Figure 2 shows a typical railway crosstie and the test method for Modulus of Rupture.

Figure 2: Crosstie and MOR Test
The ties in this paper are made in a closed mold process using glass fiber reinforcement and recycled thermoplastic polymer. The units are opaque, so visual detection of a void within a tie is not possible. The manufacturer of the tie requested detection of a 12mm (0.5”) diameter void within the tie.
2. Experimentation
Testing and experimentation took the form of 3 successive stages, all aimed at producing a fairly quick result. The first stage was a bench scale test to determine if the inspection requirement was feasible. The second stage was to determine if readily available ultrasonic instrumentation could be used to obtain and produce data for analysis. The third was to determine if the results could be scaled to match production requirements.
The ultrasonic equipment used was Olympus Epoch 1000 or Epoch 650 ultrasonic flaw detector with Panametrics M2008 (0.5MHz) transducers with elastomer delay lines.
2.1 Bench Testing
The initial bench-scale testing used a sample FRP crosstie that was provided by the manufacturer. The objective was to determine if a 12.7mm diameter hole as a simulated void, located at the midpoint of the 225mm width could be detected using ultrasonic techniques.
A 12.7mm hole was drilled into the tie at the midpoint of the tie and detection was attempted using pulse-echo and thru-transmission methods. Figure 3 shows the tie. Note that the tie is completely opaque. The ultrasonic energy is required to traverse the full 225mm width of the tie in order to interrogate all of the material for the required defect. Typical pulse path is shown in Figure 3a.
Conventional practice for ultrasonic testing to find defects such as voids is to use the Pulse-Echo method in which an ultrasonic pulse is applied to one surface [4], the pulse traverses the material to the opposite surface and a reflection returns for detection by the same transducer. Voids along the path of the pulse will return reflections earlier than the opposite surface reflection and they can be classified based on standardized testing methods. From experience with non-destructive evaluation of fiber reinforced thermoset polymers [1] [3], it was clear that the attenuation of the ultrasonic signal through the tie was too large for use of pulse echo technique to detect the required void. To address this, a technique known as “through transmission” [4], in which the applied pulse was detected by a second transducer on the opposite surface of the tie and opposite the transducer supplying the energy. Using methods and procedures similar to those used in [1] and [3] , the amount of attenuation of the transmitted signal was quantified to determine if a defect of the required size blocked part of the signal path. Note that the methods used do not have corresponding standards at this writing.
A coupling agent was used to increase ultrasonic signal transfer into the tie. The tie surface was uneven and the coupling agent was required to provide for this stage was a relatively viscous glycol-based ultrasonic couplant product.
Results from the through-transmission testing showed clear detection of the simulated void and it was determined that the next stage of testing was possible.

Figure 3: FRP Crosstie with hole location marked a) Top View
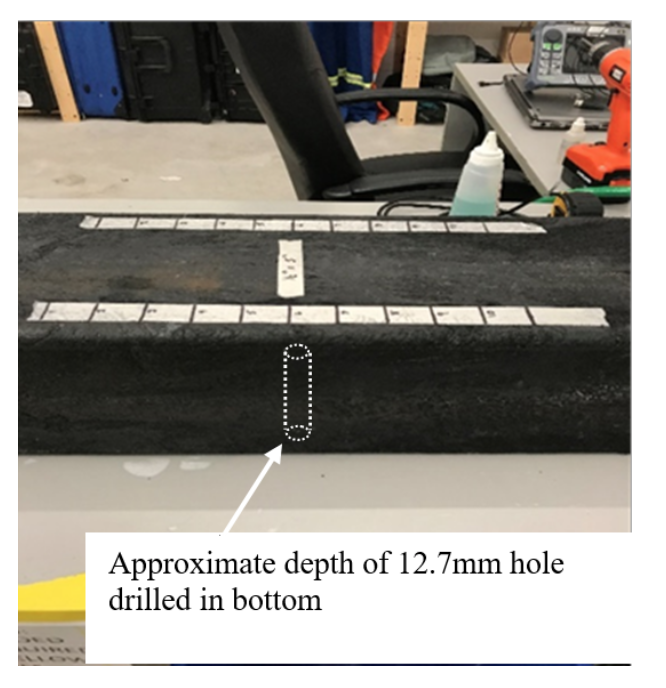
Figure 3: FRP Crosstie with hole location marked b) Side View
2.2 Automation Testing
If the defect could be detected, the next phase was to determine if the detection could be automated. The automation testing required development of custom computer software to control the ultrasonic test instrument (flaw detector). Only the Olympus Epoch 650 device was able to be used for this.
Using the tie sample from Figure 3, a simple jig was prepared that would apply transducers to the left and right side of the tie. A water flow was used as the coupling agent and the jig was manually pulled along the tie. Readings were taken at about 0.6 second intervals, which was the switching limit of the ultrasonic instrument. The readings were evaluated to determine if the defect could be detected and results could be provided to operators within a nominal 3 minute time frame.
Figure 4 shows the simple jig. The wires connecting the ultrasonic transducers are not shown. The green hose is connected to a water supply that was used to conduct ultrasonic energy between the transducers and the railway tie. Jig alignment was maintained by guides on the underside of the member that rests on the top of the railway tie.
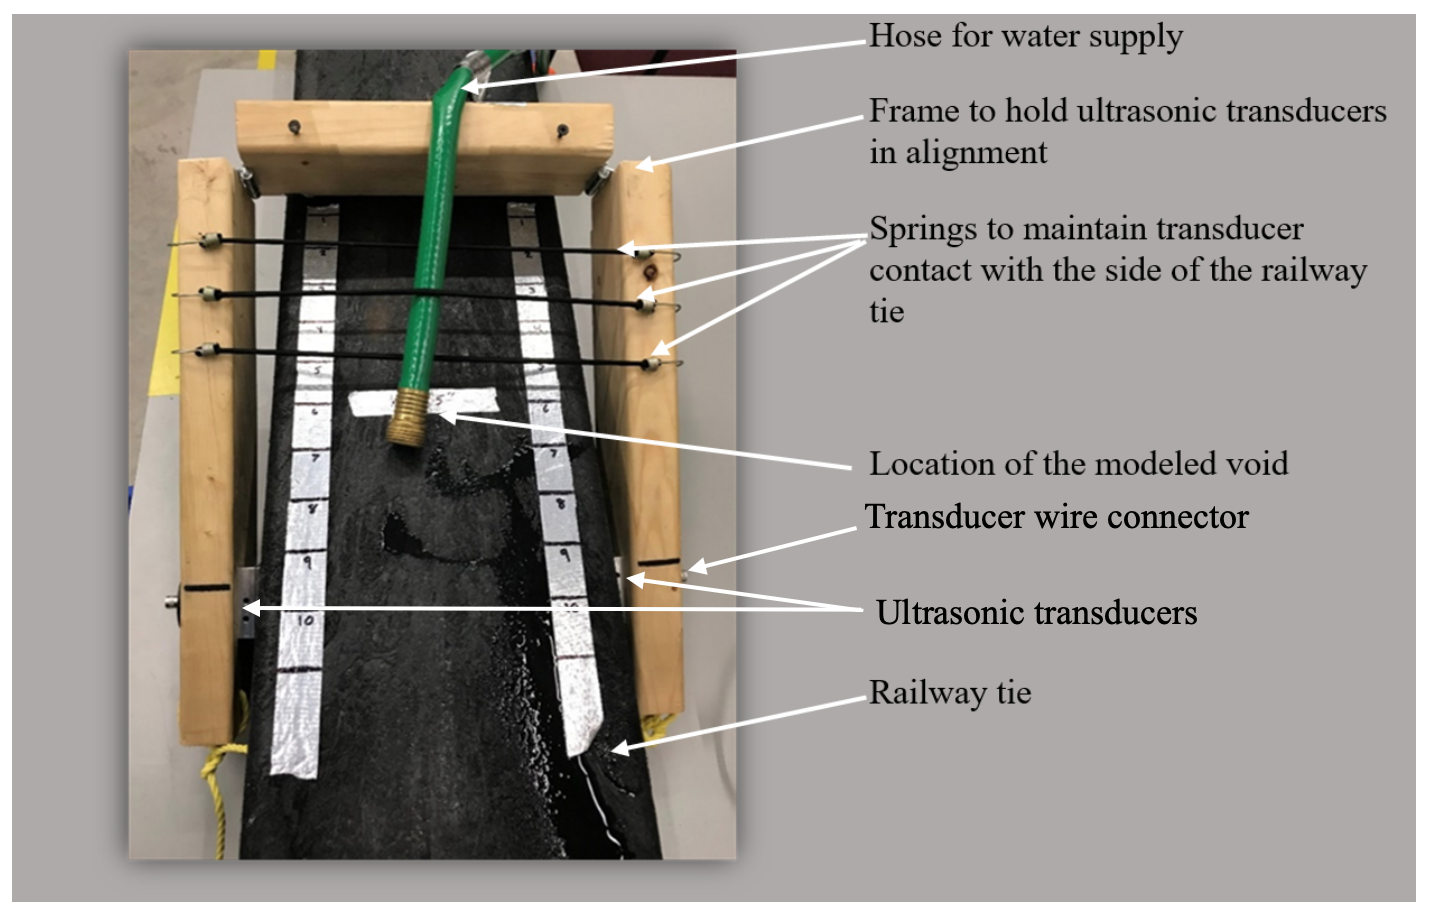
Figure 4: Simple Jig to Test Automated Detection
At this time, the manufacturer supplied some additional samples that had known MOR values. These samples were also used in the lab testing.
2.3 Prototype Scale Testing
The next phase was to determine the required operating parameters for a possible automated inspection installation. The samples that had known MOR values were used in the testing so that operating parameters could be developed. To that end, a prototype was constructed and used to test FRP railway tie segments supplied by the manufacturer.
The items to be investigated were ensuring adequate coverage of ultrasonic tests to identify the specified defects, integrating software and ultrasonic test equipment to complete the testing, local analysis of readings, ensuring contact for final geometry, evaluating wear from friction and reporting.
As an adjunct test, since samples were provided with known MOR values, reading data was compared to the MOR values. Several comparisons were made, using average values and weighted average values using the parallel axis theorem.
3. Results
3.1 Bench Testing
The first key finding was that complete transfer of ultrasonic energy from the transducer to the rail tie did not occur, even when several different coupling agents were used. This is illustrated in Figure 5. The vertical axis represents the magnitude of signals received by the transducer and the horizontal axis shows the time from signal application. The charts shown in Figure 5 are known as A-scans.

Figure 5: Ultrasonic energy transfer in to tie
When pulse echo methods were used, repeatable detection of the drilled holes was not possible. It was concluded that automated detection of the target defect was not possible using pulse-echo method.
Considering the ultrasonic energy transfer into the tie from Figure 5, it was clear that evaluation of attenuation using thru-transmission methods requires appropriate scale adjustment based on the net energy input to the surface. A new technique had to be developed to determine and apply the scaling factor to thru-transmission readings.
The technique used is to take a reference pulse-echo reading of the transducers when not coupled. Then take a pulse-echo reading with the transducers coupled to opposite sides of the tie, in the same location as the thru-transmission readings. These readings can be used to establish the “Net Energy to Tie” as shown in Figure 5. The last step is to take a thru-transmission reading from the tie.
When the readings are taken and saved, the raw data is then extracted and the thru-transmission results are scaled by applying the Scaling Factor shown in equation 1.
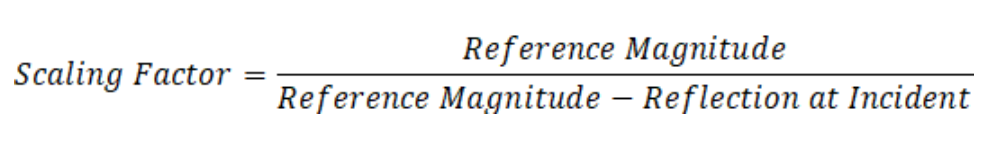
Equation 1
When this procedure was followed, the location of the artificial defect was detected based on the attenuated magnitude of the thru-transmission reading.
3.2 Automation Testing
This stage of testing determined whether the ultrasonic equipment could be used with a supervisory computer to complete the procedure determined in 3.1. It was also determined whether the supervisory computer would be able to extract the raw data as required to provide results to operators within a 3 minute time frame.
The transducer was moved continuously to simulate a scanning process but sampled data is actually acquired at 2 readings per transducer diameter.. The pulse-echo readings were not taken at the same locations as the thru-transmission readings, so the calculations averaged the pulse-echo readings before and after the thru-transmission readings. Figure 6 shows results from the scanning process to detect the drilled hole. The actual hole was at Location 6 where the dip in reading value is clear. Note that locations 1 and 4 show a deeper dip than Location 6 – these are probably locations of larger defects or high attenuation. In any case, the minimum threshold for a known 12mm defect could be established and values that were below the threshold would qualify as defects.

Figure 6: Defect Detection
Final results of the data run were available within a few seconds of completion of the data collection.
The Scale Factor that was used for some of the data sets from the new samples is shown in Figure 7. Note that the values are all greater than 1, meaning that the raw data would under-report the actual values. Coefficient of variation of the Scale Factors is from 9% to 22% showing that there can be significant variation along the length of a tie.

Figure 7: Scale Factor Required
3.3 Prototype Scale Testing
Figure 8 shows the configuration that was used for prototype level testing. Guards and safety devices have been removed. The ties enter from the side of the camera and a water shower is used a s coupling agent. The black circles in the flat plate are spring-loaded transducers that are paired counterparts on the opposite side of the tie. These provide almost 100% coverage of the rail tie.
The final configuration required 10 transducers and 5 ultrasonic flaw detectors. The transducers are spaced equally along the 178mm face of the tie. All are controlled by a supervisory computer and Programmable Logic Controller system that incorporates all of the control mechanisms discussed above.
Several results developed from the prototype testing:
The variation within individual crossties was relatively small along the length of each unit. Significant local variations were rare.
A good correlation was observed between the weighted results and the Modulus of Rupture values for the samples where that information was available. Figure 9 shows the correlation curve. The R2 value reported on the chart represents the square of the correlation. A value of 1 corresponds to a perfect match. A value greater than 0.7 is considered to be a good correlation.
Approximately 100% inspection of the rail ties can be made within 150 seconds, or 2.5 minutes.

Figure 8: Prototype

Figure 9: Correlation of Data to Modulus of Rupture
4. Conclusions
This work investigated non-destructive inspection of FRP rail ties. Requested performance was to detect a void or defect of 12mm diameter or greater within the rail tie. The investigation started with bench testing and proceeded through three (3) stages to determine if detection can be automated and culminated with demonstration of 100% inspection by a prototype fixture.
Bench testing used conventional ultrasonic flaw detector equipment with a simulated defect as a drilled hole in a tie supplied by the tie manufacturer. After bench testing showed successful detection, automation testing was completed using a simple fixture and controlling a single ultrasonic instrument to scale the readings and calculate attenuations with a custom computer program. The prototype fixture required five (5) pairs of transducers to provide full coverage of the rail tie in a single pass through the fixture. For each pair of transducers, a separate ultrasonic instrument was used and all were coordinated using a custom computer program.
Some of the rail ties tested had known modulus of rupture values from destructive testing and these correlated very well to the attenuation values from all transducers combined. The results of this testing have shown that the original requirement for defect detection can be enhanced with performance prediction.
To summarize the conclusions:
- 100% ultrasonic inspection of FRP rail crossties can be completed at a rate of about 20mm per second.
- Defects of 12mm and greater can be detected.
- High correlation has been found between destructive structural performance of FRP rail crossties and ultrasonic results.
5. References
| [1] | G. E. Clarkson, “Baseline Values for Non-Destructive Structural Evaluation of Glass Reinforced Composites,” CAMX, Orlando, 2014. |
| [2] | E. J.M. Juran, Juran’s Quality Control Handbook, New York: McGraw-Hill Inc, 1988. |
| [3] | G. E. Clarkson, “System and Method for Analysis of Fibre Reinfgorced Composites”. United States Patent 9989502, 5 06 2018. |
| [4] | R. K. S. Don. E. Bray, NonDestructive Evaluation, New York: McGraw-Hill Book Company, 1989. |
Copyright 2019 by UTComp Inc. Published by The Composites and Advanced Materials Expo with permission.